
| En Français | Home/Contact | Billiards | Hydraulic ram | HNS | Relativity | Botany | Music | Ornitho | Meteo | Help |
Current or durable consumer products offered on the markets do not always have the expected quality. The main causes are the following :
F1.1. "Construction" defect of the product
Three types of fault exist :
In France nearly 10 % of electronic devices purchased on the Internet are returned due to non-compliance.
For domestic electrical devices, the faulty component is often the electronic block of the device (examples : freezer, steam iron, thermal resistance of towel dryers, lighting of bathroom cabinets with touch control, outdoor solar light garland, DVD player).
F1.2. Non-optimal user manual
The product user manuel is sometimes succinct, poorly structured, roughly translated into French or written only in English, which does not allow consumers to use the product easily and appropriately.
F1.3. Non-optimal consumer service
Access to consumer service is not always easy (examples : unclear access methods, premium rate telephone number, unspecified waiting time).
Furthermore, the processing of requests and complaints is sometimes disconcerting or even flawed, with some operators not always having sufficient training in the products and services in the catalog, in internal procedures and in IT tools.
F1.4. Premature and planned obsolescence of the product
Planned obsolescence is a market practice justified by manufacturers for economic (see Consumer society), technical and risk prevention reasons. The consumer suffers the consequences : he is frustrated when he notices that the effective lifespan of his product does not correspond to the lifespan he expects.
But the causes of obsolescence are not only linked to the producer. They may occur during sale, distribution or consumption. This is why we speak more widely of premature obsolescence.
Different types of premature obsolescence can shorten the life of consumer products [CLI][HIP] :
France is the first country in the world to have criminalized planned obsolescence through article L. 441-2 of the Consumer Code dated March 14, 2016.
Law n 2021-1485 of November 15, 2021 relating to the reduction of the digital environmental footprint in France (REEN law) then modified this article by redefining the offense as follows : "The practice of planned obsolescence is prohibited which is defined by the use of techniques, including software, by which the person responsible for placing a product on the market aims to deliberately reduce its lifespan".
Warning : there may be "obsolescence" without it being planned. It is up to the consumer to provide proof of the voluntary intention of the manufacturer to reduce the life of the product : difficult or even impossible task.
One of the solutions aimed at combating planned obsolescence is the services rental. Instead of owning a good, we would pay for the service rendered. Companies would then benefit from manufacturing durable and easily repairable goods (example : Xerox in the professional photocopier market) [WIK].
F1.5. Sources relating to planned obsolescence :
[HIP] HIPPOCAMPE, Usages numériques et terminaux.
[CLI] LE CLIMATOSCOPE, L'obsolescence prématurée de nos produits de consommation : un débat à remodeler.
[WIK] WIKIPEDIA, Obsolescence programmée.
The consumer society is a type of society within which consumers are encouraged to consume goods and services on a regular and abundant basis [JDN].

F2.1. Introduction :
The consumer society appeared in Western countries from the second half of the 20th century, at the same time as some trends such as the women emancipation, industrial and technological innovation, globalization of trade.
The economy will then rely on the production capacities of companies as well as on the consumption capacities of citizens. It will increase the living standard of a large number of citizens in terms of comfort and material well-being, by increasing access to goods and services in volume and diversity.
But gradually a new paradigm is emerging : "consume more, produce more, earn more". Producers and consumers then mechanically become hyper-producers and hyper-consumers. The first ones offer an abundant supply based on products with a limited lifespan (Premature obsolescence). The seconds have demands that go well beyond their primary needs.
F2.2. Results :
This situation, where producers and consumers are closely linked around the industry of "desire", has resulted in the following consequences on the individual and their environment :
1. On an information level, the media (press, edition, poster, radio, television, cinema, Internet network, telecommunications) broadcast to the consumer (reader, listener, spectator, Internet user) a mass of more or less accurate information, amplified by social networks and content sharing platforms.
Broadcast can take different forms :
2. On an audiovisual communication level, the media, whose concern is to preserve a market more than to ensure the civic education of the masses, become a source of sensory pollution and overstimulation of the senses to the detriment of useful information [BEN]. See Media violence.
3. On an ecological level, overconsumption encourages waste and the production of waste which pollutes, even if progress is made to recycle it as cleanly as possible.
4. On a nutritional level, overconsumption promotes the appearance of pathologies such as diabetes and obesity.
5. On a professional level, the perpetual creation of new needs can lead to over-indebtedness, overwork or insecurity.
6. On a psychological level, the search for "always more" can lead to continual frustration which generates discomfort, depressive and even aggressive behavior.
7. On a social level, the human being has also become a "product" who must "know how to sell himself", who must enter into "competition", "at war" with everyone and others.
8. On a moral level, consumer objects become ends in themselves leading to a loss of "true purpose".
9. On the human level, social relations become simple means and are therefore artificial. We must then differentiate ourselves from others, in particular by impressing others with symbols of wealth and power to the detriment of the authenticity and depth of human relationships.
10. On a spiritual level, having replaces being, depth, introspection, reflection on identity based on something other than possessions [GUI].
F2.3. Conclusions :
Today the consumer society, which has become a society of overconsumption, is beginning to move towards a society of deconsumption along four axes : individual, community, systemic and environmental :
1. Individual sufficiency which consists of consuming less and differently, favoring quality rather than quantity.
To be applicable at the level of each consumer, this sobriety must be "happy", that is to say without the idea of restriction or sacrifice. Examples : second-hand purchase, recourse to repair, return to essential needs.
This trend would be driven in France by the elderly (with fewer needs), women (attracted towards ecology) and the most qualified (attracted towards a form of daily asceticism) [GOL][CAS].
2. Collaborative economy based on the sharing or exchange between individuals of goods (car, housing, parking, drill, etc.), services (passenger transport, DIY, etc.) or knowledge (computer courses, communities of learning, etc.), with or without monetary exchange, with or without digital networking platform.
By reducing or even eliminating intermediaries, this economic system allows you to moderate your expenses and save money.
3. Circular economy focused on a sustainable strategy which consists of sharing, reusing, repairing, renovating and recycling products and materials for as long as possible so that they retain their value.
In France, we can cite the following examples :
4. Waste management which consists of collecting it and then transforming it, prioritizing in order: reuse, recycling, elimination [MTE].
In France, in 2018, 66 % of treated waste is recycled, 7 % is incinerated with or without energy recovery and 27 % is landfilled [NOT].
F2.4. Sources relating to consumer society :
Sources relating to consumer society :
[ADE1] ADEME, Economie circulaire : notions, 2013.
[ADE2] ADEME, Potentiels d'expansion de la consommation collaborative pour réduire les impacts environnementaux, 2016.
[AGE] Agence Lucie, L'économie circulaire.
[ALT] Altermaker, Economie circulaire : définition et exemple.
[BEN] Abdellatif Bensfia, "François HEINDERYCKX (2003), La malinformation. Plaidoyer pour une refondation de l'information", Communication, Vol. 23/2 | 2005, 259-265..
[CAS] Jean-Laurent Cassely, Les diplômés, bons élèves ou cancres de l'alterconsommation ?, in Constructif, juin 2021 (N 59).
[CHI] Chilowé, Comment vivre la sobriété heureuse au quotidien ?.
[DES] Cécile Désaunay, Vers la déconsommation ?, in Constructif, juin 2021 (N 59).
[GOL] Mathilde Golla, La société de déconsommation commence à faire son chemin, Novethic.
[GUI] Valérie Guillard, La société de consommation, cours PSL Paris-Dauphine.
[IMP] impots.gouv.fr, Economie collaborative et plateformes numériques.
[JDN] JDN - Journal du Net, Consommation : définition simple.
[MAR] Margaux, Société d'hyperconsommation : comment en sommes-nous arrivés là ? Comment changer demain ?, Suricates Consulting.
[ODI] ODI - Observatoire de la Déontologie et de l'Information, L'information au coeur de la démocratie - Rapport Annuel 2017.
[RUM] Yannick Rumpala, Quelle place pour une "sobriété heureuse" ou un "hédonisme de la modération" dans un monde de consommateurs ?, in Dans L'Homme & la Société 2018/3 (n 208), pages 223 à 248.
[TOU] La Toupie, Toupictionnaire.
[WIK1] Wikipedia, Société de consommation.
Sources relating to waste management :
[ADE3] ADEME, Déchets chiffres-clés - Edition 2023.
[MTE] Ministère de la transition écologique et de la cohésion des territoires, Traitement des déchets.
[NOT] notre-environnement, Le traitement des déchets.
[REC] Recygo, Poubelles de tri sélectif, comprendre les codes couleurs.
[SEN1] Sénat, Les nouvelles techniques de recyclage et de valorisation des déchets ménagers et des déchets industriels banals.
A survey is, by definition, a statistical method of analyzing a population based on a sample of this population.
It are mainly used for political purposes (to help with decision-making), electoral purposes (to exist in the political landscape), commercial purposes (to anticipate sales of a product or find out customer satisfaction), activist purposes (to defend a cause) or media purposes (to build audience).
The quality of the information collected depends largely on the rigor surrounding the design and completion of the survey, as well as the interpretation of results.
The important parameters of a survey are as follows :

F3.1. Sample size [GUM][SER] :
Sample size is a determining factor in obtaining reliable results.
The following formula (Cochran's formula) determines the number of people (n) to question based on the margin of error (m) that can be tolerated on a proportion of responses (p).
n = σ2 x p (1 - p) / m2
p is the expected proportion of responses relative to the sample size n (when p is unknown, we use p = 0.5).
m is the error margin tolerated for the proportion p, the confidence interval equal to [p - m, p + m].
NC is the confidence level (or probability) that the answers are within the error margin (m).
z is the quantile of order α/2 of the reduced centered normal distribution for a given confidence level NC = 1 - α (z = 1.96 for NC = 95 %, z = 2.58 for NC = 99 %).
With a confidence level of 95 % and an error margin of 5 %, the calculation gives : n = 384.16
With a confidence level of 99 % and an error margin of 2 %, the calculation gives : n = 4144.14
For a sufficiently reliable market study, we most often accept a confidence level of 95 % and an error margin of 5 %, which requires interviewing 400 people.
Note that the error margin only takes into account random error, that is to say the possible differences between sample and reference population due solely to random sampling [TOU]. It does not take into account all other errors (representativeness of the sample, quality of the questionnaire, conduct of the survey, analysis of the results).
|
Proof of Cochran's formula [WIK1][WIK2][WIK3] : We seek to estimate the real proportion (p) of a population likely to respond positively to a questionnaire. To do this, we carry out a survey on a restricted population by submitting the questionnaire to a number (n) of individuals drawn at random. The survey is assumed to be based on a simple random sample from a large population. If we repeat the operation several times, the proportion of responses obtained then follows a binomial law with mean p and standard deviation σ = (p (1 - p) / n)1/2 For n sufficiently large, this binomial law is very close to a normal law with mean p and standard deviation σ To obtain the margin of error (m) on the proportion p, we simply multiply the standard deviation σ by the factor z of the reduced centered normal distribution for a given confidence level (NC), which gives : m = z σ = z (p (1 - p) / n)1/2 Hence the formula : n = σ2 x p (1 - p) / m2 Note that the margin of error is maximum for p = 0.5 |
F3.2. Representativeness of the sample :
The sample must be representative of the reference population if we want to extrapolate the survey results to the entire population.
- If it is a random survey carried out from a sample drawn at random from the entire population, it must be ensured that the sampling base is complete, up to date and without repetition, and containing all categories of society (origin , sex, age, profession, region, etc.) [GUM][LAL]. This is the method used for example for major surveys carried out by INSEE [TOU].
- If it is a selection survey with judicious choice (quota methods), it must be ensured that the quotas are substantially proportional to the fraction of the population represented by each category. This option is favored by polling institutes in France and applied to much smaller samples, generally 1000 or 2000 people [TOU].
- Internet surveys allow you to interview large numbers of people at low cost. However, email lists are generally not representative and 20 % of the population, not "connected to the Internet", is omitted [LAL].
F3.3. Clarity of the questionnaire :
- Indicate the total estimated time to answer the questionnaire, which should not be too long as it risks tiring the participant.
- Limit the questionnaire to 15 questions and each question to a single subject comprising 20 words maximum. For example, asking "How do you rate the quality of our product and customer service ?" leads to confusion which leads to ignoring the question.
- Avoid sensitive questions linked in particular to money, religion, intimacy, sexuality or family conflicts.
- Adapt the vocabulary to that of the population interviewed. For example, the question "France devotes around a quarter of national income to financing social protection. Do you consider this to be excessive, normal or insufficient ?" can be advantageously simplified by the question "Do you think that enough is spent on social protection ?".
- Give a definition of acronyms, technical words and little-used words.
- Do not use restrictive words such as "always", "never", "all" or "none", which prevent people from qualifying their comments and responding objectively.
- Do not ask imprecise questions, such as : "Have you been to the cinema recently ?" or "How much gasoline do you consume on average ?".
- Do not ask questions based on statements, such as : Do you agree with the statement "The police should not intervene" ?
- Do not ask questions containing superlatives or subjective adjectives, even emotionally charged or controversial, such as : "Was our customer service excellent ?" or "How amazing was your stay at our hotel ?".
- Do not ask questions containing implying words, such as : "Are you afraid of noise in your home ?" or "Are you excited to discover our new online store ?".
- Do not ask questions containing negative terms, such as : "Do you prefer not to use electrically assisted bicycles during your bike rides ?".
- Never use a double negative such as : "In your opinion, is the use of glycophate not without danger ?".
F3.4. Effectiveness
of the questionnaire :
- Prefer closed questions (single choice or multiple choices, to be selected from a list of options) to open questions (collection of opinions), the latter leading to a long and difficult statistical analysis of the responses.
- For each closed question, limit the number of options, without forgetting the "Not concerned" or "Without opinion" option.
- Avoid imprecise options, such as "usually" or "often", replace with a clear concept such as "every day" or "more than twice a week".
- Avoid the single binary choice "Yes"/"No" which leads people to respond in a less thoughtful way and favors the "Yes" answer to appear more pleasant (positivity bias or tendency to acquiesce [JAC][SOU]). Instead, offer a single choice between two or more response options.
- For single choices with more than 2 options, prefer the choice with 4 balanced options, such as : "Very satisfied", "Satisfied", "Dissatisfied", "Very dissatisfied".
- For single choices with more than 2 options consisting of ranges, ensure that they are mutually exclusive, such as : "2 years or less", "3 to 5", "6 or more".
- For single choices with more than 2 options consisting of grades (1 to 4 for example), explicitly mention that grade 1 corresponds to the lowest grade.
- For multiple choices, classify them in alphabetical order, without forgetting the "Other" option.
- Add contextual information to explain and guide the participant in their responses.
F3.5.
Neutrality of the questionnaire :
You should only give credit to surveys whose questions are as neutral as possible. Some questions call for answers. For example [LAL] :
- IF we ask "Do you prefer to use the old version or this improved version of the website ?", this is a biased question since the question implies by the word "improve" that the latest version of the site is best.
- If we ask "Do you think airlines should allow the use of cell phones in flight ?" the answers will not be the same as if we ask "Do you think airlines should ban cell phone use in flight ?"
- If we ask "Do you find it important that security rules at airports are tightened ?", most people will answer in the affirmative. However, if we tell them about the conditions that will accompany this greater security (longer waits, increased police presence, increased ticket costs, etc.), their opinion may be different.
- If we ask "Are you in favor or against sanctioning judges in the event of a fault leading to a judicial error ?", who would not want to sanction someone who has committed a fault ?
F3.6. Conduct of the survey :
When the survey is carried out in the "field" (face-to-face or telephone survey), it is necessary to ensure that :
- The investigators are serious, professional, well trained, neutral in appearance, welcoming and relational.
- The place, time and circumstances are propitious. For example, only launch the survey when the media context is relatively neutral in relation to the subject of the survey.
- The participant is available to answer the questionnaire.
F3.7. Analysis of results :
The understanding and interpretation of the results are sometimes very different depending on the analyst. For example [LAL] :
- If business travelers are asked "Do you often, occasionally, rarely or never use Internet access in your hotel room ?", the results will differ greatly depending on the groupings that we will provide answers. Does the "yes" result corresponding to the "often" case also include the "occasionally" case, or even the "rarely" case ?
- If the results show that "60 % of Canadians use their credit card to pay for their vacations", then the information should not be condensed into the form "Canadians travel on credit".
F3.8. Adjustment of results [DAN] :
Adjustment is a common practice in the world of surveys.
It consists of applying weightings to individuals to increase the weight of those belonging to categories under-represented in the sample surveyed compared to the reference population, and to simultaneously reduce the weight of those who are over-represented.
Adjustment on a single variable corresponds to a simple rule of 3. Adjustment on several variables at the same time is more complex and requires lengthy computer calculations.
But be careful, excessive weightings pose a certain risk to the quality of the results. Thus, it seems absurd to give 10 times more weight to the answers of the only person we managed to interview in a given category.
It is also possible that the calculations do not allow the sample questioned to converge towards the desired distribution.
Thus, if data is false from the start, if it was poorly collected, incorrectly entered, or if it contains too much missing data, there will be no point in trying to correct it.
Hence the extreme importance of ensuring that samples consistent with the reference population are obtained in advance.
F3.9. Publication of results :
Any published survey must be accompanied by certain information.
The French law of July 19, 1977 regulates surveys made public on the national territory and linked to the electoral debate. They must mention at least the purpose of the survey, the name of the organization, the name of the sponsor, the number of people questioned, the date, the exact wording of the questions asked and the proportion of "unanswered" [DOC].
F3.10. Reliability of surveys :
Concerning the reliability of the surveys, opinions are divided :
For some people, despite their faults, surveys are good indicators of trends and opinions [LAL]. They are not wrong when they are well done and observed in a trending manner.
For others, surveys reflect an opinion formed on the spot. Responding to a pollster doesn't commit you to anything. This can even be an opportunity to play, or even to express your anger at the moment.
The surveys also reflect an opinion drowned out in the media noise surrounding the question asked.
But most often, the survey is used to build audience. Its relevance is almost never mentioned.
Only in-depth surveys, repeated from year to year, are of interest in understanding changes in values over the long term [COS].
F3.11. Sources relating to surveys :
[COS] Centre d'observation de la société, Le sondage - un mauvais outil pour comprendre la société.
[DAN] Gérard Danaguezian, Le redressement d'échantillons, Survey Magazine.
[DOC] Doctrine, Loi n 77-808 du 19 juillet 1977 relative à la publication et à la diffusion de certains sondages d'opinion.
[GUM] Hervé Gumuchian et Claude Marois, Chapitre 6 - Les méthodes d'échantillonnage et la détermination de la taille de l'échantillon, in Initiation à la recherche en géographie, Presses de l'Université de Montréal.
[JAC] Marc Jacquemain, Méthodologie de l'enquête, Institut des Sciences Humaines et Sociales, Université de Liège.
[LAL] Michèle Laliberté, L'art des sondages ou comment éviter les pièges, Réseau Veille Tourisme.
[PER] Anne Perrut, Cours de probabilités et statistiques.
[SER] Zineb Serhier, Comment calculer la taille d'un échantillon pour une étude observationnelle ?.
[SOU] Dr. Ghomari Souhila, Techniques d'Enquête, Université de Tlemcen.
[TOU] Hugo Touzet, Connaître et mesurer l'opinion publique : utilité et limites des sondages, Ressources en Sciences Economiques et Sociales.
[WIK1] Wikipedia, Intervalle de confiance.
[WIK2] Wikipedia, Marge d'erreur.
[WIK3] Wikipedia, Loi normale.
When we have a data set, for example from numerous measurements, it is often useful to characterize it by parameters of central tendency (such as the arithmetic mean or the median) and dispersion (such as the standard deviation or the interquartile range).
It is also important to know the influence of aberrant data on these parameters.
Finally, the statistical method has a certain number of traps into which even experienced users can fall.
Consider a list of n data xi, the index i ranging from 1 to n. The most common statistical parameters are then the following :
F4.1. Aberrant data [WIK5]
Aberrant data is data that contrasts greatly with other data, in an abnormally low or high manner.
Aberrant date is due to :
- either a measurement error in which case it is necessary to delete the aberrant data or use robust statistical indicators in the face of aberrant data,
- or to a highly asymmetrical data distribution in which case one must be very careful in using tools or reasoning designed for a normal distribution.
Different methods exist to identify aberrant date present in a dataset.
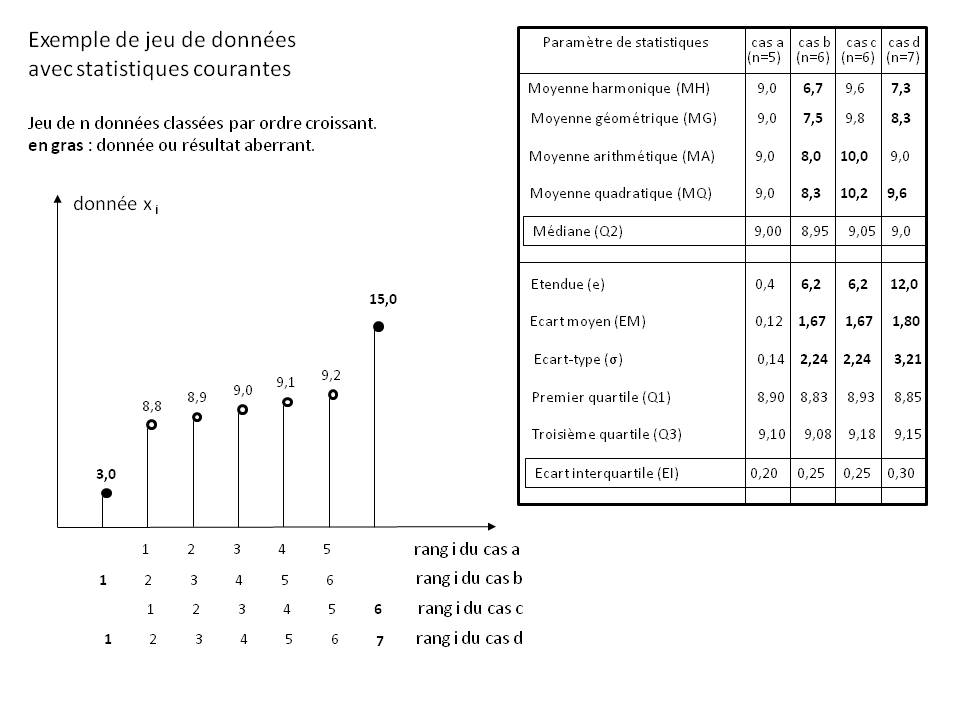
The simplest [KHA] consists of classifying the data in ascending order then identifying the first quartile (Q1), the third quartile (Q3) and the interquartile range EI = Q3 - Q1.
Any data xi verifying one of the following relationships will then be considered aberrant :
xi < Q1 - 1,5 EI or xi > Q3 + 1,5 EI
The Figure above shows an example dataset with aberrant data (shown in bold font).
The table on the right shows the influence of these aberrant data on the calculation of the various common statistical parameters for four particular cases :
case a : set of 5 data without any aberrant data
case b : set of 6 data including those of case a supplemented by an abnormally low data
case c : set of 6 data including those of case a supplemented by an abnormally high data
case d : set of 7 data including those from case a supplemented by aberrant data from cases b and c
The analysis of this table is given below for each statistical parameter.
F4.2. Parameters of central tendency
The main parameters of central tendency are as follows, including the median which is robust to aberrant data.
Generalized mean Mp [WIK2] :
For n strictly positive data xi, the generalized mean of non-zero order p (or H lder mean) is the quantity : Mp = ( (1/n) ∑i[xip] )(1/p)
This mean is used in practice with :
p → -∞ for the data minimum Min{xi}
p = -1 for the harmonic mean MH
p → 0 for the geometric mean MG
p = 1 for the arithmetic mean MA
p = 2 for the root mean square MQ
p → +∞ for the data maximum Max{xi}
Between different means, we have the following relationship : Min{xi} ≤ MH ≤ MG ≤ MA ≤ MQ ≤ Max{xi}
The generalized mean does not depend on the order of the data.
The generalized mean is homogeneous : for any strictly positive constant k, we have the relation : Mp(k xi) = k Mp(xi)
The generalized mean is cumulative : if the data list is divided into several sublists, the mean of the overall list is the weighted mean of the means of the sublists, with the coefficients of each sublist being the number of terms concerned.
The generalized mean can be expressed in the form of a norm of order p :
|
Proof of the generalized mean for p → 0 [WIK3] : For p → 0, Mp takes the indeterminate form 1∞ We then rewrite Mp in the form : Mp = exp[X] with : X = ln[ ( (1/n) ∑i[xip] )(1/p) ] = (1/p) ln[ (1/n) ∑i[xip] ] = f(p)/g(p) f(p) = ln[ (1/n) ∑i[xip] ] g(p) = p Having furthermore f(0) = ln[1] = 0 and g(0) = 0, we can apply the Hospital rule subject to the existence of f'(p) and g'(p) : f'(p) = ∑i[ xip ln[xi] ] / ∑i[xip] using the relations ln'(u) = u'/u and (xp)' = xp ln[x], and provided that x is strictly positive. g'(p) = 1 Hence (Hospital rule) : lim(p → 0)(X) = lim(p → 0)( f(p)/g(p) ) = f'(0)/g'(0) = (∑i[ 1 ln[xi] ] / ∑i[1]) / 1 = ∑i[ ln[xi] ] / n = ln[ Produiti[xi] ] / n The exponential function being continuous everywhere and defined at 0, we can then write : lim(p → 0)(Mp) = lim(p → 0)(exp[X]) = exp[ lim(p → 0)(X) ] = exp[ ln[ Produiti[xi] ] / n ] = (exp[ ln[ (Produiti[xi] ] ])1/n = (Produiti[xi])1/n which is indeed the expression of the geometric mean. |
|
Proof of the generalized mean for p → ±∞ [WIK3] : For large values of p such that p → +∞, we can write : ∑i [xip] = xmaxp ∑i [ (xi/xmax)p ] = xmaxp where xmax = Max{xi} From where : lim(p → +∞) ( (1/n) ∑i[xip] )(1/p) = lim(p → +∞) ( (1/n) xmaxp )(1/p) = lim(p → +∞) ( (1/n)(1/p) xmax ) = xmax For small values of p such that p → -∞, we can write : ∑i [xip] = xminp ∑i [ (xmin/xi)-p ] = xminp where xmin = Min{xi} From where : lim(p → -∞) ( (1/n) ∑i[xip] )(1/p) = lim(p → -∞) ( (1/n) xminp )(1/p) = lim(p → -∞) ( (1/n)(1/p) xmin ) = xmin |
Harmonic mean MH [WIK1] :
For n strictly positive data xi, the harmonic mean is the quantity : MH = ( (1/n) ∑i[xi-1] )(-1) which can also be written : 1/MH = (1/n) ∑i[1/xi]
The harmonic mean is to be used when we seek to mean a quantity which influences according to an inverse proportionality in a physical phenomenon (example : mean speed of a vehicle on journeys of the same length).
The harmonic mean minimizes the squared deviation defined by the sum ∑i[ (1/x - 1/xi)2 ]
Example [BIB] : you take a bike ride. You start by climbing a hill of length L at speed v1 = 20 km/h, then you go back down this same hill at speed v2 = 30 km/h. What is your mean speed v ? Please note, this is not 25 km/h found by taking the arithmetic mean.
If t1 = L/v1 is the time taken to ascend and t2 = L/v2 the time to descend, then the total time t = 2 L/v is written : t = t1 + t2 = L/v1 + L/v2 , or again : 2/v = 1/v1 + 1/v2
The mean speed v is therefore the harmonic mean of the two speeds v1 and v2, i.e.: v = 24 km/h.
The MH harmonic mean is highly sensitive to aberrant data when it is abnormally low relative to other data (see Table above).
Geometric mean MG [WIK1] :
For n strictly positive data xi, the geometric mean is the quantity : MG = ( Produiti[xi] )1/n which can also be written : ln[MG] = (1/n) ( ∑i[ ln[xi] ] )
The geometric mean is to be used when we seek to have a balanced representation of the influence of low data and high data thanks to their logarithmic transformation.
The geometric mean minimizes the squared deviation defined by the sum ∑i[ (ln[x] - ln[xi])2 ]
Example [BIB] : at the end of a demonstration, the police announce x1 = 100 demonstrators and the organizers x2 = 900. What is the real number x of demonstrators ? Please note, this is not 500 found by taking the arithmetic mean.
If we assume that the police and the organizers "cheat" in the same way, then the police announce (x/k) demonstrators and the organizers (x k), k being a multiplier coefficient. By taking the geometric mean, we then find the exact result : x = [(x/k) (x k)]1/2 = 300.
The MH geometric mean is highly sensitive to aberrant data when they are abnormally low relative to other data (see Table above).
Arithmetic mean MA (or "usual mean") [WIK1] :
For any n data xi, the arithmetic mean (or "usual mean") is the quantity : MA = (1/n) ∑i[xi]
The arithmetic mean minimizes the squared deviation defined by the sum ∑i[ (x - xi)2 ]
The arithmetic mean MA is sensitive to aberrant data (see Table above). It should only be calculated on a normal distribution or after identifying and removing aberrant data.
Root mean square MQ [WIK1] :
For any n data xi, the quadratic mean is the quantity : MQ = ( (1/n) ∑i[xi2] )(1/2) which can also be written : MQ2 = (1/n) ∑i[xi2]
The quadratic mean is to be used when we seek to mean a quantity which has a square influence in a physical phenomenon (example : mean speed of a particle involved in kinetic energy) or which includes values oscillating around zero (example : electrical signal).
The square mean minimizes the squared deviation defined by the sum ∑i[ (x2 - xi2)2 ]
The Root mean square Mq is highly sensitive to aberrant data (see Table above).
Weighted mean [WIK1] :
When the data are individually assigned coefficients mi (called weights), positive and not all zero, the previous means each have a weighted version as follows :
- Weighted generalized mean : Mp = ( ∑i[mi xip] / ∑i[mi] )(1/p)
- Weighted harmonic mean : MH = ∑i[mi] / ∑i[mi/xi]
- Weighted geometric mean : MG = ( Produiti[ximi] )1/∑i[mi])
- Weighted arithmetic mean (or barycenter) : MA = ∑i[mi xi] / ∑i[mi]
- Weighted quadratic mean : MQ = ( ∑i[mi xi2] / ∑i[mi] )(1/2)
If the weights are of integer value, they define the number of repetitions of each data.
When all weights are equal, the weighted mean is the same as the unweighted mean.
Median Q2 [WIK4] :
For any n data xi, the median (or second quartile) is the data Q2 located in the middle of the data xi when classified in ascending order [WIK6] :
- If n is odd, then Q2 = x(1/2)(n + 1)
- If n is even, then Q2 = (1/2)(xn/2 + x(n/2 + 1))
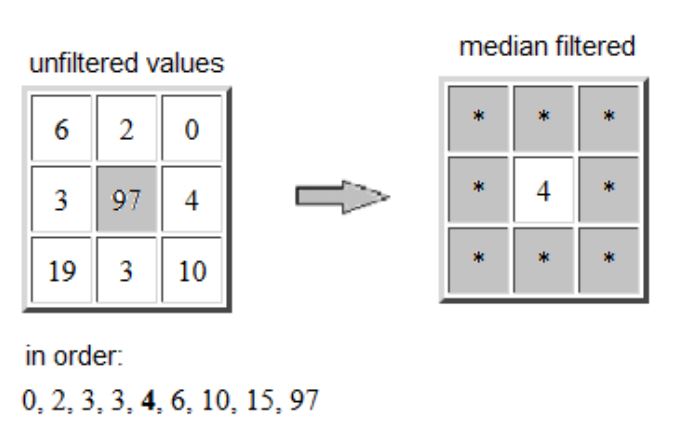
The median should be used when we seek to minimize, or even ignore, the influence of aberrant data.
The median minimizes the difference defined by the sum ∑i[ |x - xi| ]
Example : in digital image processing, the median filter reduces noise while preserving the contours of the objects in the image. The Figure above shows the example of an aberrant pixel (value 97) replaced by the median value (equal to 4) of its neighborhood made up of the eight surrounding pixels.
The Q2 median is robust to aberrant data (see Table above) and should be preferred over other means.
Weighted median [WIK9] :
When the data is individually assigned coefficients mi (called weights), which are positive and not all zero, the median has a weighted version which is the data xk which divides the mass of the weights in two when the data is classified in ascending order. We can also say that xk is the data having a cumulative weight equal to half the sum of all the weights.
k is then solution of : ∑ i = 1, k-1 [mi] ≤ (1/2) ∑i[mi] and ∑ i = k+1, n [mi] ≤ (1/2) ∑i[mi]
When two values of k satisfy the above condition (k inf and k sup), then the weighted median is : (1/2)(xk inf + xk sup)
If the weights are of integer value, they define the number of repetitions of each data.
When all weights are equal, the weighted median is the same as the unweighted median.
F4.3. Dispersion parameters
The main dispersion parameters are as follows, including the interquartile range which is robust to aberrant data.
Scope e [WIK4] :
For any n data xi, the scope (or amplitude) is the quantity : e = Max{xi} - Min{xi}.
The range e is highly sensitive to aberrant data (see Table above).
Mean deviation EM [WIK4] :
For any n data xi, the mean deviation is the quantity : EM = (1/n) ∑i[ |xi - MA| ]
where MA is the arithmetic mean of the data xi.
The mean deviation is to be used when trying to calculate the arithmetic mean of the absolute value of the deviations from the arithmetic mean.
The absolute value function not being differentiable is sometimes incompatible with certain analyses. To make the differences positive, we then resort to squaring and use the standard deviation.
The mean deviation EM is highly sensitive to aberrant data (see Table above).
Standard deviation σ [WIK4] :
For any n data xi, the standard deviation is the quantity : σ = ( (1/n) ∑i[ (xi - MA)2 ] )(1/2) = ( (1/n) ∑i[ xi2] - MA2 )(1/2)
where MA is the arithmetic mean of the data xi.
The standard deviation is to be used when trying to calculate the square mean of the deviations from the arithmetic mean.
We have the relation : EM ≤ σ
The standard deviation σ is highly sensitive to aberrant data (see Table above). It should only be calculated on a normal distribution or after identifying and removing aberrant data.
Interquartile range EI [WIK4] :
For any n data xi, the interquartile range is the quantity EI = Q3 - Q1
Q1, called lower quartile (or first quartile), is the data below which 25 % of the data xi is found when classified in ascending order [WIK6] :
- If the rank (1/4)(n + 3) is integer, then Q1 = x(1/4)(n + 3)
- If this rank ends with 0.25 then Q1 = (1/4)(3 xinf + xsup)
- If this rank ends with 0.50 then Q1 = (1/2)(xinf + xsup)
- If this rank ends with 0.75 then Q1 = (1/4)(xinf + 3 xsup)
Q3, called upper quartile (or third quartile), is the data below which 75 % of the data xi is found when classified in ascending order [WIK6] :
- If the rank (1/4)(3 n + 1) is integer, then Q3 = x(1/4)(3 n + 1)
- If this rank ends with 0.25 then Q3 = (1/4)(3 xinf + xsup)
- If this rank ends with 0.50 then Q3 = (1/2)(xinf + xsup)
- If this rank ends with 0.75 then Q3 = (1/4)(xinf + 3 xsup)
with xinf = xlower integer rank
and xsup = xupper integer rank
Interquartile range EI is robust to aberrant data (see Table above) and should be preferred over scope e, mean deviation EM and standard deviation σ.
F4.4. Misleading statistics
Statistics, like any other technique, is not always handled with care, discernment and good faith.
It is the subject of traps, misleading evidence and even scams.
Misleading scale :
Some graphs are presented on a linear vertical scale not starting at zero, or logarithmic, or missing altogether. In all three cases, if we do not pay careful attention to the scale, the interpretation of the variable represented can be erroneous.
The right definition :
Statistics calculated on a variable only have meaning relative to its definition.
Example [INS][WIK8][MON][JAI] : in March 2017, the number of unemployed in mainland France was 2.7 million according to INSEE and 3.7 million according to the Pôle Emploi. Where does this gap come from ?
For INSEE, an unemployed person is officially an "unemployed active" person (i.e. aged 15 or over, unemployed, actively looking for work and available within two weeks), which excludes so-called "inactive" people ( young people under 15 ; student ; retired ; people in training ; discouraged people ; women with young children, not available quickly ; people unable to work ; etc.
For Pôle Emploi, an unemployed person is a person registered with an agency, unemployed and actively looking for work (category A).
20 % of the unemployed identified by INSEE are not registered with Pôle Emploi (people at the end of their rights, people removed for administrative reasons, etc.). Conversely, 40 % of unemployed people registered with Pôle emploi are not recorded by INSEE, often to benefit from certain measures.
The unemployment rate is then defined as the ratio between the number of unemployed and the number of active people, the number of active people being the sum of the number of employed people and the number of unemployed people.
In 2022, according to the INSEE survey, employment is distributed as follows : 68.7 % employed active, 5.3 % unemployed active (unemployed) and 26.0 % inactive [UNE], the unemployment rate being 7.2 %
Cumulative percentages :
When we combine increases and decreases in percentages, a multiplicative perception of the percentages is necessary.
Example [DEL2] : a price increases by 15 % then decreases by 6 %. What is the percentage price change ? The answer is not +9 %
You must in fact multiply the price by 1.15 then by 0.94, which gives 1.081 and corresponds to an increase of 8.1 %.
Note that the reversed operation "decrease by 6 % then increase by 15 %" gives the same result, the multiplication being commutative.
Percentage and absolute value :
A quantity can decrease in percentage each year at the same time as it increases in absolute value.
Example [DEL2] : A member of the government assures that the increase in deficit which was 15 % last year has been reduced to 14 % this year. The opposition claims on the contrary that the deficit which was 15 billion euros last year has increased again this year by more than a billion euros. Who is right ?
The 15 billion euros of last year's deficit corresponds to 15 % of the initial deficit (from two years ago). This was therefore 100 billion euros. Last year, the deficit increased from 100 billion to 115 billion. If, as the first statement indicates, the increase in deficit was 14 %, this year the increase therefore reached 14 % of 115 billion, or 16.1 billion. This is consistent with the second statement that the deficit increased by more than a billion. The two statements are perfectly compatible.
The aberrant mean :
The
arithmetic mean has little meaning when the data distribution is unbalanced.
Example [DAN] : in a company of 200 people, 80 % of the workforce receives 1,500 euros per month and the remaining 20 % receives 10,000 euros per month. The average remuneration then amounts to 3,200 euros per month, which is an unrepresentative result when we take a simple arithmetic mean.
The hidden common cause :
Confusion is frequently made between correlation of factors (often linked by a common cause) and causality of facts (meaning cause and effect relationship).
Example 1 [ANI] : a person who has diabetes will have high blood sugar levels and feel excessive hunger. The two factors are linked and come from the same cause, which is diabetes. But high sugar levels do not cause feelings of excessive hunger, and vice versa. These are related facts but not by causality.
Example 2 [TER] : people who wear shoes larger than 45 commit three times more murders than those who wear shoes between 40 and 42. Does this mean that large shoes induce murderous behavior ? The real correlation is actually linked to gender : it turns out that homicidal behavior is found primarily in male individuals.
Law of small numbers :
The law of small numbers pushes individuals to believe that a small number of observations can accurately reflect the general population.
Example 1 [ANI] : if we count 70 % women at a meeting and we use this proportion of 70 % to guess the number of women in the world, this generalization is false because it is not representative of reality nor the randomness of the sample.
Example 2 [ANI] : it is not because we were cured using a grandmother's remedy that it really works for the entire population. This is why in medicine many tests are carried out to find out whether or not a treatment has a beneficial effect.
Paradox of the average number of children
:
"Taking a family at random" and "taking a child at random" are not the same thing.
Example [DEL2] : An exhaustive survey carried out in a city indicates that families with children under 18 are distributed as follows : 10 % families with 1 child, 50 % with 2 children, 30 % with 3 children , 10 % to 4 children. The average number of children per family (among those with children) is therefore (10 + 100 + 90 + 40)/100 = 2.4.
To check this statistic, the administrative authorities carry out a survey. We survey 1,000 children under the age of 18 carefully chosen at random and ask them how many children there are in their family, including themselves. By averaging the answers, we get 2.67 ! Why is this gap so significant with the 2.4 in the statistic which took into account all families with children ?
The answer lies in the fact that by interviewing children at random, you will interview 4 times more children from families with 4 children than you will from families with 1 child, which skews the average. If there are 1000 families, there will be 100 only children, 1000 children belonging to a family of 2 children, 900 children belonging to a family of 3 children, 400 children belonging to a family of 4 children. In total, the answers given by these 2,400 children will lead to the result of 2,666... children per family.
The survey carried out does not evaluate the average number of children in a family taken at random, but the average number of children found in the family of a child taken at random.
Simpson paradox :
A phenomenon observed in several groups of data can be reversed when the groups are brought together. If we want to obtain sensible conclusions, the aggregation of results must respect certain rules of homogeneity [DEL2].
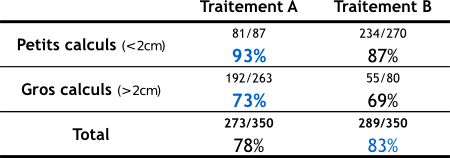
Example [WIK7][SCI][DEL1] : A patient has kidney stones. His doctor offers him two alternatives: treatment A and treatment B. To help him make his choice, the doctor informs him that a study was carried out on 700 patients. Half of them (i.e. 350) received treatment A for which there were 273 cures (i.e. 78 % of cases), and the others received treatment B for which there were 289 cures (i.e. 83 % of cases).
We also know that there are two types of calculations : small and large (see small table above).
- Treatment A is successful in 81 cases out of 87 for small stones (i.e. 93 % of cases) and in 192 cases out of 263 for large stones (i.e. 73 % of cases).
- Treatment B is successful in 234 cases out of 270 for small stones (i.e. 87 % of cases) and in 55 cases out of 80 for large stones (i.e. 69 % of cases).
In both cases (small or large stones), treatment A is more effective, while for the overall result, treatment B is more effective.
What creates the paradox, and the erroneous impression that B is more effective overall, is that treatment A was given much more often for large stones, which are more difficult to treat.
To occur, the paradox requires two conditions :
- existence of an often hidden variable (called a confounding factor) which significantly influences the final result. In this example, the size of the stones affects the likelihood of treatment success.
- heterogeneous distribution of the sample studied. Treatment A is in fact more often given to large stones and B to small ones.
In science, we carry out "randomized" experiments, which ensure a homogeneous distribution : for example, if you have kidney stones and you participate in an experiment to compare treatments, you are randomly assigned treatment A or B , without the size of the calculations influencing the decision. We thus erase the heterogeneity of distribution, and the paradox disappears : treatment A will be clearly seen as being the best [MAT].
When Simpson's paradox occurs, one of the solutions to eliminate it is to make the distribution homogeneous by modifying the numbers in each data group while retaining the percentages. In the "Small calculations" line, the ratio 81/87 can be replaced by 251.38 /270 giving the same percentage 93 %. In the "Large calculations" line, the ratio 55/80 can be replaced by 180.81 /263 giving the same percentage 69 %. The "Total" line then gives a ratio of 443.38 /533 = 83.17 % for treatment A and 414.81 /533 = 77.83 % for treatment B, which confirms that treatment A is the best.
|
Arithmetic proof [DEL1] : If we denote A, B, C, D the four successive numbers of the "Total" line, a,b,c,d those of the "Small calculations" line and a', b', c', those of the "Large calculations" line, then we have the following relationships : A = a + a' ; B = b + b' ; C = c + c' ; D = d + d' A/B < C/D ; a/b > c/d ; a'/b' > c'/d' The astonishment comes from the fact that we believe that the double inequality { a/b > c/d and a'/b' > c'/d' } leads to { A/B > C/D }, or even with only small letters: { (a + a')/(b + b') > (c + c')/(d + d') } But in fact, the three inequalities can sometimes be true simultaneously on an arithmetic level. When the data have same effect within each group (b = d and b' = d') or between groups (b = b' and d = d'), Simpson's paradox cannot occur, the double inequality { a/b > c/d and a'/b' > c'/d' } always resulting in { A/B > C/D }. |
F4.5. Sources relating to statistics :
[ANI] Animafac, Les pièges de l'utilisation des chiffres.
[BIB] Bibm@th.net, Diverses moyennes.
[CAN1] Statistique Canada, Mesures de la tendance centrale.
[CAN2] Statistique Canada, Mesures de la dispersion.
[DAN] Gérard Danaguezian, Attention, statistiques !, Survey Magazine.
[DEL1] Jean-Paul Delahaye, L'embarrassant paradoxe de Simpson, Pour la Science, n 429 de juillet 2013.
[DEL2] Jean-Paul Delahaye, Déjouer les pièges des statistiques, Pour la Science, Hors-Série n 98 de février-mars 2018.
[KHA] Khan Academy, Identification des valeurs aberrantes avec la règle 1,5 x écart interquartile
[MAT] Johan Mathieu, Le paradoxe de Simpson.
[UNE] Unédic, Comprendre le halo du chômage.
[SCI] Science étonnante, Le paradoxe de Simpson.
[TER] Marc Tertre, Pourquoi faut-il se méfier des statistiques ?, Le Club de Mediapart.
[WIK1] Wikipedia, Moyenne.
[WIK2] Wikipedia, Moyenne d'ordre p.
[WIK3] Wikipedia, Discussion : Moyenne d'ordre p.
[WIK4] Wikipedia, Indicateur de dispersion.
[WIK5] Wikipedia, Donnée aberrante.
[WIK6] Wikipedia, Quartile.
[WIK7] Wikipedia, Paradoxe de Simpson.
[WIK8] Wikipedia, Chômage en France.
[WIK9] Wikipedia, Médiane pondérée.

F5.1. Definition :
In a society of excessive consumption, we are witnessing a commodification of the whole of society. Information becomes a commodity, subject to the laws of the market and competition, as do TV programs, cinema, film productions and the media in general.
To capture the audience in this highly competitive context, the media resort to different means such as sensationalism, controversy and sometimes even fake news.
Violence is also one of these means, giving rise to what is called media violence which is, by definition, human violence shown or suggested by the media, whether verbal, physical, sexual or psychological.
F5.2. Human violence :
The animal does not seek to kill or cause suffering. It kills to feed, reproduce or defend its territory. It is neither peaceful nor cruel and never acts excessively [GAN].
Even a cat playing with a mouse to the death is not trying to cause suffering. It is only training to hone its hunting skills.
The human being is also an animal, but an animal of excess. It is distinguished from animals by the anatomical and functional importance of its brain [GAN], in particular the neocortex devoted to thought, imagination and anticipation, which allows it to explore and exploit an increasingly extensive environment.
Since the beginning of humanity, around two million years ago, human beings have been inventive with an exploring, manipulative, conquering and aggressive side. This fundamentally creative character tears him away from nature and makes him enter into excess and transgression. He then becomes ingenious in matters of violence, torture and horror, reinforced by his primitive animality in the form of celebration, sacrifice, cruelty and warlike orgy [GAN].
Thus, the neocortex, the seat of our higher cognitive abilities, stimulates our tendency to explore and possess. Human violence results from this natural quest for expansion and control.
Today, modern man is no more violent than in the past. Wars have become increasingly deadly in the 20th century, but they are becoming rarer. Criminal violence has been on the decline since the 19th century. However, it appears worse than before because we approach criminal phenomena with different standards from those used in the past, being accustomed to increasingly broad security [GAN].
The reduction in violence is thus a massive and incontestable phenomenon. But there can be periods of relapse, setback, regression. Man is civilized but he does not change in depth. The impulses, the frustrations, the violent temptations remain [PIN].
Violence is a universal fact. Wisdom consists of accepting it rather than repressing it [GAN]. But wisdom also consists of discovering that all conflict is good as long as it reveals a truth, in particular that we are obliged to agree in order to live and that the conflict does not need to be violent for that [MIC].
Svâmiji said : "The animal is subject to nature. Man fights against nature. The wise man achieves unity with nature by accompanying it in its movement".
F5.3. Forms of media violence :
The following alphabetical list gives the main forms of media violence against human beings, ranging from simple annoyance to extreme violence.
F5.4. Controversy :
Many people do not believe in the effects of media violence. There are six reasons for this [COU] :
F5.5. Results :
On human being, the effects of media violence are mainly those of violent images (bloodshed, beatings, torture, killings, bombings, road accidents, suicide, rape, etc.).
On this topic, more than 50 years of scientific research shows that prolonged exposure to violent images makes people more violent, increases the fear of becoming a victim themselves and reduces the feeling of sympathy towards victims of violence in real life [COU][WIK9].
On children and adolescents, the effects of media violence are as follows [CBS] :
- From 0 to 2 years : high vulnerability to sound effects (noises and screams).
- From 2 to 7 years : vulnerability to intense, trivialized, antisocial or gratuitous violence.
- From 7 to 12 years old : vulnerability to intense, trivialized, antisocial or intellectual violence.
- From 12 to 18 years old : vulnerability to antisocial or spiritual violence.
The most harmful programs for young people are violent films, including some cartoons, and realistic television news. The greatest impact is achieved by the association of violence with erotic images [KUC].
The representation of violence has even more negative impact when [SEN4] :
- It is represented as justified or rewarded ;
- The violent protagonists are attractive or heroic ;
- The consequences for the victims are minimized ;
- The spectator is young or predisposed to aggression.
Also note [KUC] :
- The number of programs for young people, especially of good quality, seems insufficient (less than 10%), which encourages young people to watch programs for adults that are totally unsuitable for their age.
- Some boys with an aggressive character identify more easily with combative heroes whose behavior they reproduce in reality as well as in the fiction they have watched (mimetic effect).
- On American television, 20 to 25 violent acts per hour are broadcast in children's programs.
- On Canadian television, sexual relations between unmarried partners are shown 24 times more than those between spouses [NIH].
F5.6. Conclusions :
The remedy for media violence consists of finding a better balance between producers of violent images and consumers. This mainly involves the following actors [COU] :
F5.7. Sources relating to media violence :
[ART] ARTE Radio, Prise de son : les 15 erreurs du débutant.
[BEN] Abdellatif Bensfia, "François HEINDERYCKX (2003), La malinformation. Plaidoyer pour une refondation de l'information", Communication, Vol. 23/2 | 2005, 259-265..
[BIL] Philippe Bilger, Pourquoi le son français est-il si mauvais ?.
[BOU] Marie-Claude Bourdon, Médias culture et violence.
[CBS] CBSC, Canadian Broadcast Standards Council, Classement des émissions en fonction de la violence - Guide de référence.
[CLE] CLEMI, Le centre pour l'éducation aux médias et à l'information, Ecrans et violence.
[CNR] CNRTL, Centre National de Ressources Textuelles et Lexicales, Sexisme.
[COU] Courbet D. & Fourquet-Courbet M.P. (2014), "L'influence des images violentes sur les comportements et sur le sentiment d'insécurité chez les enfants et les adultes", Rapport Technique de Recherches, Université d'Aix-Marseille, Institut de Recherche en Sciences de l'Information et de la Communication IRSIC.
[CSA] CSA - Conseil supérieur de l'Audiovisuel, Réflexion sur les émissions dites "de téléréalité".
[FLA] Jean-Yves Flament, Téléréalité et idéologie.
[FMV] Fondation Marie-Vincent, Qu'est-ce que la violence sexuelle ?.
[FRI] France Inter, Algorithmes : les meilleurs amis des climatosceptiques.
[GAG] Christophe Gagne, "Un bon clash pour faire le buzz", Corela, 19-2 | 2021.
[GAN] René-François Gagnon, Cinq conceptions de la violence quotidienne, Mémoire 1999, Université Laval.
[GDC] Gouvernement du Canada, Ravaler sa douleur - Etude des liens entre l'anorexie, la boulimie et la violence contre les femmes et les filles.
[GDQ] Gouvernement du Québec, Le sexe dans les médias, Editions du Conseil du statut de la femme.
[GOU] Vincent Goulet, "Violence et médias", séances du Réseau Thématique n 37 "Médias" du 3e congrès de l'Association Française de Sociologie, Paris, 14-17 avril 2009.
[HIL] David Hiler, Réchauffement climatique : comprendre ceux qui n'y croient pas, Le Temps.
[KUC] Corinne Kucharscki, Jean-Luc Saladin, Daniel Godefroy et Matthieu Blondet, La télévision nourrit la violence, Reporterre - Le média de l'écologie.
[LER] Pierre Leroux et Philippe Riutort, Intégrer les politiques aux divertissements.
[LOO] Joséphine Loock, Violence institutionnelle de l'administration publique.
[MAT] Philippe Mathieu, Pour une histoire et une esthétique de l'écran fragmenté au cinéma, Thèse 2010, Université de Montréal.
[MCC] Ministère de la Culture et de la Communication, La violence à la télévision.
[MDT] Ministère du travail, La protection contre les discriminations.
[MIC] Yves Michaud, La violence apprivoisée.
[NIH] NIH, National Library of Medicine, Les répercussions de l'usage des médias sur les enfants et les adolescents.
[PAG] PagesJaunes/PagesConseil/Droit/, Atteinte à la dignité.
[PER] Perplexity, le moteur d'Intelligence Artificielle développé par Perplexity AI.
[PIN] Steve Pinker, La diminution de la violence dans le monde est un phénomène massif et incontestable, Libération.
[RFI] RFI, Les ados et le sexe sur internet : attention danger!.
[RIM] Pierre Rimbert, Interdire l'information en continu ?, Le Monde diplomatique.
[SEN2] Sénat, Enfants et publicité télévisuelle.
[SEN3] Sénat, L'audiovisuel à l'ère du numérique.
[SEN4] Sénat, Violence dans les médias : quelles conséquences sur les enfants et la société ?.
[SIX] Nicolas Six, Pourquoi les dialogues sont-ils parfois aussi inaudibles dans les films et les séries ?, Le Monde.
[TOU] La Toupie, Toupictionnaire.
[TRO] Pauline Trouillard, "Atteinte à la dignité humaine et autres contenus toxiques à la télévision française : le Conseil d'Etat a t-il ouvert la boîte de Pandore ?", La Revue des droits de l'homme, 24 | 2023.
[WIK2] Wikipedia, Cyberharcèlement.
[WIK3] Wikipedia, Perversion.
[WIK4] Wikipedia, Violence conjugale.
[WIK5] Wikipedia, Violence psychologique.
[WIK6] Wikipedia, Télé poubelle.
[WIK7] Wikipedia, Téléréalité.
[WIK8] Wikipedia, Violence policière.
[WIK9] Wikipedia, Education parentale.
[WIK10] Wikipedia, Entertainment Software Rating Board.
[YAP] yapaka.be, Les images violentes ne sont pas nécessairement celles que l'on croit.
Email attacks, also known as phishing attacks, are becoming more and more common and more sophisticated [CYM][CYS][KEP].

F6.1. Structure of an email :
An electronic mail (or "email" or "mail") is a written message transmitted via a computer network, from one electronic mailbox to one or more others, allowing almost immediate communication between a sender and one or more recipients.
Email uses protocols like SMTP for sending and POP/IMAP for receiving.
A complete email consists of several parts :
An email address has a syntax defined mainly by the RFC 5322 standard as follows [CHA][PER] :
|
Please note that it is strongly recommended to use lowercase letters in email addresses. The domain of the email address (after the "@") is not a problem because it is case-insensitive (lower or uppercase) according to DNS (Domain Name System) standards. On the other hand, the local part (before the "@") remains case-sensitive, and the use of uppercase letters in this part, although technically allowed, can lead to several risks, mainly for the sender : 1. Input errors. A recipient may provide an incorrect version of their address by omitting the uppercase letters, or a sender may mistranscribe an address containing uppercase letters. 2. Delivery failures. Although rare, some servers still treat the local part of email addresses as case-sensitive, which can prevent emails from being received. |
F6.2. Receiving a suspicious email :
When you receive a suspicious email, there is no major risk in simply opening the email.
Depending on the recipient's email client configuration, the sender may only collect the following technical data about the recipient :
1. Email address. Example : jane.smith@company.com
2. Device type. Examples : Desktop, Mobile, Tablet
3. IP address (IP = Internet Protocol) : unique identifier assigned to each device connected to the Internet. Example (official website of the University of Burgundy : www.u-bourgogne.fr) : 194.199.107.34
4. Approximate geolocation (estimated position of the device connected to the Internet using its IP address). Example (for www.u-bourgogne.fr) : France, Bourgogne-Franche-Comté, Côte-d'Or, Dijon, approximate GPS coordinates : 47.3220 N, 5.0415 E
5. Operating system (OS). Examples : Windows 10 64-bits, macOS 11.5.2, Ubuntu Linux 64-bits, Android 13
6. Web browser type and version. Examples : Chrome 118.0.5993.88, Firefox 118.0.2
7. Web browser rendering engine. Examples : HTML engine (Blink, Gecko, Webkit), 3D engine for video games and 3D software, Engine for 3D image synthesis
8. Preferred Web browser language. Examples : fr-FR, en-US
9. Type of email client. Examples : Gmail, Outlook 365, Apple Mail
10. Date and time the email was opened. Example : 2024-10-02 14:32:22 UTC+2
This data can be used later by the cybercriminal for more targeted attacks.
F6.3. Structure of a suspicious email :
The criteria for identifying a suspicious email are as follows [CHA][PER] :
- Sender address whose local part or domain contains one of the following typical anomalies :
- a series of random letters or numbers (examples : contact-entreprise8765@gmail.com, contact-entreprise@gmail-5g78.com
- an inversion between two characters (notably "l" and "capital i", "l" and "1", "O" and "0"). Examples : john.d0e@example.com, help@paypaI.com, support@paypa1.com, info@micros0ft.com
- multiple hyphens (example : help@secure-paypal-login.com)
- a single spelling mistake that escapes attention (example : john.does@example.com, help@amazom.com)
- an unusual domain extension, notably certain free extensions such as .tk, .ml, .ga (example : john.doe@example.tk)
- Unexpected email. Example : invoice or unordered package.
- Inconsistent email compared to the sender's usual communications :
- at the address level. Example : email claiming to come from a bank and using a Gmail address.
- at the format level. Examples : logo, header, colors or different layout.
- at the content level : lack of customization. Example : "Dear customer, we have detected suspicious activity on your account. Please click here to secure it. Kind regards. The security team."
- Content with image instead of text (which prevents the email from being detected by spam filters).
- Spelling or grammatical errors. Example : "Thank you for you're trust."
- Mention of a wonderful offer or promise of easy winnings. Example : "Congratulations. You have won a 200 euro voucher at Amazon ! Click here to claim it now."
- Request for personal or sensitive information. Example : "Please provide us with your credit card number for verification."
- Request to deactivate antivirus, firewall or any other security measure to open an attachment or visit a site.
- Insistent, urgent or threatening tone. Example : "URGENT : your account will be blocked in 24 hours if you do not respond immediately."
- Attachment with unusual format (.exe, .zip, .scr, etc.). Example : "Please open the attached urgent_bill.exe file to check your outstanding balance."
- Link pointing to a suspicious web address.
F6.4. What not to do :
- Trust completely based on the sender address alone. It can be spoofed (see Checkpoints).
- Click on a link or image
- View images that are not loaded
- Open or download an attachment
- Reply to or forward the email
- Provide personal or sensitive information (bank details, password, etc.)
- Contact the sender using information provided in the email (phone number, email, etc.)
- Ignore a warning from your email or antivirus software that the email is potentially fraudulent.
F6.5. What to do :
- Stay calm
- Take the time to check the legitimacy of the email (sender's address, format and content of the email)
- Check links without clicking on them (by hovering over them to see the real URL)
- Copy part of the email (such as the subject or key phrases) and do an Internet search to see if other people have reported this email as fraudulent
- Preserve evidence through screenshots
- Delete email
- Change the default font of the email client to clearly distinguish between an "l" and a "capital i": switch to Times New Roman, or Georgia or Verdana for example.
F6.6. Checkpoints to identify a spoofed email [CHA][PER] :
1. View the email header details, either by right-clicking on the email (without opening it and selecting "Show original" or "Show source code"), or by opening the email (and selecting the ad hoc menu).
Examples of menus (by opening the email) : Orange (Details - Full header), Gmail (Plus, Afficher l'original), Free (Other actions - Show original), Windows Live Mail (Properties - Details).
2. Locate the following fields :
- From : indicates the sender's email address.
- Return-Path or envelope sender or MAIL FROM : indicates the email address to which undeliverable messages should be returned.
- DKIM-Signature or DKIM-Filter or X-DKIM-Result (optional field) : indicates whether the message was authenticated using the DKIM (DomainKeys Identified Mail) method.
- Received-SPF or SPF or X-Received-SPF or X-SPF (optional field) : indicates whether the message was authenticated using the SPF (Sender Policy Framework) method.
- Received-DMARC or MARC-Filter or X-DMARC-Result (optional field) : indicates whether the message has been authenticated using the DMARC (Domain-based Message Authentication, Reporting & Conformance) method
.
- Authentication-Results or X-Authentication-Results (optional field) : gives the results of the different authentication methods performed by the different servers (intermediate servers and receiving server).
3. Compare the "Return-Path" field with the "From" field : Two cases are possible : 1. The email addresses must be identical, 2. The Return-Path field must have a domain (indicated after "@") corresponding to a known server (verify this by typing this domain into an internet search engine).
4. Compare the "DKIM-Signature" field with the "From" field : Two cases are possible : The domain indicated after "d=" in the "DKIM-Signature" field must either be identical to the email domain (indicated after "@" in the "From" field) or correspond to a known server (verify this by typing this domain into an internet search engine).
5. Examine the "Received-SPF" field : the "fail" status must not appear.
6. Examine the "Received-DMARC" field : the "fail" status must not appear.
7. Examine the "Authentication-Results" field : the statuses "dkim=fail", "spf=fail" and "dmarc=fail" must not appear.
F6.7. Example of a normal (non-spoofed) email header [PER] :
From: "John Doe" <john.doe@example.com>
To: "Jane Smith <jane.smith@company.com>
Subject: Team meeting weekly
Date: Fri, 4 Oct 2024 09:45:21 +0200
Message-ID: <1234567890@mail.example.com>
MIME-Version: 1.0
Content-Type: text/plain; charset="UTF-8"
Content-Transfer-Encoding: quoted-printable
Return-Path: <john.doe@example.com>
Received: from mail.example.com (mail.example.com [192.0.2.1])
by inbound.company.com (Postfix) with ESMTPS id ABC123
for <jane.smith@company.com>; Fri, 4 Oct 2024 09:45:23 +0200 (CEST)
DKIM-Signature: v=1; a=rsa-sha256; c=relaxed/relaxed;
d=example.com; s=dkim;
h=from:to:subject:date:message-id; bh=...snip...; b=...snip...;
Received-SPF: pass (company.com: domain of john.doe@example.com designates 192.0.2.1 as permitted sender) client-ip=192.0.2.1; envelope-from=john.doe@example.com; helo=mail.example.com;
Authentication-Results: inbound.company.com;
dkim=pass header.i=@example.com;
spf=pass (company.com: domain of john.doe@example.com designates 192.0.2.1 as permitted sender) smtp.mailfrom=john.doe@example.com;
dmarc=pass (p=NONE sp=NONE dis=NONE) header.from=example.com
F6.8. Sources relating to suspicious email :
[CHA] ChatGPT, le moteur d'Intelligence Artificielle développé par OpenAI.
[CYM] cyber-malveillance.gouv.fr, Comment reconnaître un mail de phishing ou d'hameçonnage ?
[CYS] Cyber-securite.fr, Comment savoir si j'ai ouvert un mail douteux ?
[KEP] Keeper, Pouvez-vous être piraté simplement en ouvrant un e-mail ?
[PER] Perplexity, le moteur d'Intelligence Artificielle développé par Perplexity AI.
When browsing the web, it is essential to know how to identify questionable web addresses, as clicking on a suspicious link can expose you to major risks such as theft of personal data, malware infections and online scams.

F7.1. Structure of web address :
A web address (or URL - Uniform Resource Locator) is the unique address of a resource (web page, file, data, etc.) on the Internet.
A web address has a syntax defined mainly by the RFC 3986 standard as follows [CHA][PER] :
F7.2. Structure of suspicious web address :
The criteria for identifying a suspicious web address are as follows [CHA][PER] :
- Site with unsecured exchanges (http protocol instead of https) when it includes a personal data entry form. Note that a purely "showcase" http site is not very dangerous.
- Web address whose domain contains one of the typical anomalies of a suspicious email address
- IP address from an unsolicited email or an unknown source
- IP address used alone, without context or identification of a legitimate organization
- Special IP address that should not normally appear on the public Internet. The list of these addresses is as follows :
F7.3. What not to do :
- Click on the link.
F7.4. What to do :
- Check the owner of the IP address or domain using tools like WHOIS
- Analyze the reputation of the site via forums or specialized cybersecurity sites
- Copy the link and do an Internet search to see if other people have reported this link as fraudulent
- Preserve evidence through screenshots
- Change the default font of the email client to clearly distinguish between an "l" and a "capital i": switch to Times New Roman, or Georgia or Verdana for example.
F7.5. Sources relating to suspicious web address :
[CHA] ChatGPT, le moteur d'Intelligence Artificielle développé par OpenAI.
[PER] Perplexity, le moteur d'Intelligence Artificielle développé par Perplexity AI.
Two topics of artificial intelligence (AI) are presented below : AI engines and robotics.
F8.1. AI engines
The AI engines provided by modern artificial intelligence have strengths but also limitations that show that AI engines cannot be used as sources of absolute truth.
On the other hand, they are powerful tools when used critically and in addition to human expertise.
Let us examine these aspects in more detail.

F8.1.1. Operation [CHA][PER] :
All generative text AI engines build their response word by word, predicting at each step, from the question asked and the available data, the word most likely to follow the words already generated.
The goal is therefore not to "say what is true", but to "say what is probable" based on the available data.
The available data comes from three sources : data learned during training (frozen at the knowledge cutoff date), data retrieved from the web in real time (for engines that have access to it), and the context of the ongoing conversation.
In simple terms, the engines then calculate internally a confidence score based on the similarity between the available data and their correspondence with the question asked.
- If this score exceeds a sufficiently high threshold (decision threshold), the engine produces an answer in a probabilistic manner, which may correspond to an exact answer, an adapted answer (through interpolation or extrapolation from nearby data), or a full hallucination. However, the line between these three types of answers, although defined internally by a confidence score and a decision threshold, remains completely opaque to the user.
- In the opposite case, most engines produces a negative answer or request clarification in order to reduce the risk of hallucination.
|
Conclusion : Thus, all AI engines produce more ou less hallucinations, biases, and errors, which users cannot detect directly. It is therefore essential to cross-check the information provided by an AI engine through cross-verification with other recognized sources or other AI engines. This approach - a cornerstone of journalistic and scientific work - offers two key advantages : - It effectively limits hallucinations, biases, and errors. - It enables selecting the best from each source to achieve a more comprehensive and reliable synthesis. Notes : - Reliability rates : Any comparison between AI engines based on reliability rates remains arbitrary due to the heterogeneity of training data and evaluation methods. To date, no robust benchmark exists to objectively assess the reliability of AI engine responses. Most reliability rates lack a unified definition, and even when they exist, evaluations do not cover all engines. - Response quality : AI engines always strive to provide the response closest to the posed question. Users must therefore formulate their questions clearly, precisely, and structured. |
F8.1.2. Advantages [CHA][PER] :
Current AI engines have some serious advantages, in particular :
F8.1.3. Major limitations and flaws [CHA][PER] :
Current AI engines have some major flaws and intrinsic limits that affect the quality of the answers provided. These are mainly explained by :
- the probabilistic operation of the engine.
- the quality, representativeness and freshness of the training data.
- the quality of the raw data collected on the Web as well as that of the filtering carried out on this data.
- the absence of an internal verification mechanism.
- the opacity of the algorithms ("Black box" effect) which favors the appearance and persistence of faulty reasoning that is difficult to detect and correct.
These include :
F8.1.4. How to choose and use an AI engine properly ? [CHA][PER] :
It seems that the major AI players will have adopted two distinct strategies for AI engines :
- Google and Microsoft have chosen to offer free versions with improvable quality, deemed sufficient for mainstream consumer needs (Gemini and Copilot engines).
- Anthropic, Perplexity AI and OpenAI have prioritized a quality-driven approach, even with free access (Claude, Perplexity and ChatGPT engines). Claude and Perplexity excel in answer reliability, while ChatGPT excels in the completeness of its answers and its editorial and explanatory quality. All three offer an intuitive and well-structured user interface, as well as contextual follow-up to ensure the flow and consistency of conversations.
Upgrading to a paid version also improves the user experience and provides access to some additional features. But this doesn't guarantee that major flaws inherent in some AI engines will be addressed, such as their inability to consider all parameters of a question or to provide consistent contextual follow-up.
Furthermore, it is important to know how to choose and use an AI engine correctly :
F8.1.5. Key factors of an AI engine [CHA][PER] :
An optimal user experience of an AI engine is based on several key factors :
According to cross-referenced estimates from Similarweb, FirstPageSage, StatCounter, and xpert.digital for 2025-2026, the global conversational AI market appears to be increasingly structured around a clear split between two segments :
- In the consumer segment (B2C), ChatGPT dominates unchallenged, driven by its historical head start and brand awareness (65 %), ahead of Gemini (21 %), Perplexity (6 %), Claude (4 %) and Copilot (1 %). Gemini is advancing rapidly thanks to its native distribution within the Google ecosystem. Perplexity has established itself as the reference for AI-powered search. Claude and Copilot remain marginal in this segment.
- In the professional segment (B2B), the rankings shift dramatically. Claude leads at number one (32 %), ahead of ChatGPT (25 %), Gemini (15 %), Copilot (13 %) and Perplexity (8 %, estimated). This reversal is driven by entirely different selection criteria : data security, data governance (GDPR compliance), reliability on complex tasks, and integration into existing workflows.
The key takeaway from this market is that visibility and profitability tell two very different stories - a single enterprise contract being worth infinitely more than a million free queries.
F8.2. Robotics
Modern robotics, whether domestic or industrial, has significant advantages but remains constrained by significant dangers.
Risks related to technical or software failures, as well as uncertainties in the face of unforeseen environments, often limit the use of robots to strictly controlled spaces in order to guarantee the safety of humans.
Let's examine these aspects in more detail.


F8.2.1. Advantages of current robotics [CHA][PER] :
Current robotics has the following main advantages :
F8.2.2. Limits and dangers [CHA][PER] :
The main limitations and dangers of current robotics are as follows :
F8.2.3. Advenir of domestic robots [CHA][PER][PET] :
Domestic robots embody a promising vision of the future where technology is put at the service of humans to improve their quality of life.
However, this vision can only be realized if technical robustness, safety and social responsibility are reconciled.
Domestic robots must not only be technically efficient and reliable, but also be thoughtfully and harmoniously integrated into our homes. This integration must take into account their social, psychological and ethical impacts.
If these complex challenges are successfully addressed, domestic robots could become essential partners in our daily lives. Otherwise, the risks and questions they raise could slow down their adoption, limiting their future to niche uses.
F8.3. Sources relating to artificial intelligence :
[CHA] ChatGPT, le moteur d'Intelligence Artificielle développé par OpenAI.
[PER] Perplexity, le moteur d'Intelligence Artificielle développé par Perplexity AI.
[PET] Régis Petit, Contribution à l'intégration de la vision passive tridimensionnelle en robotique : suivi de contours, calibrage de caméra et commande cinématique de robot, Thèse de Docteur-Ingénieur, INPT Toulouse, 1985.
 Last page update : June 8, 2026.